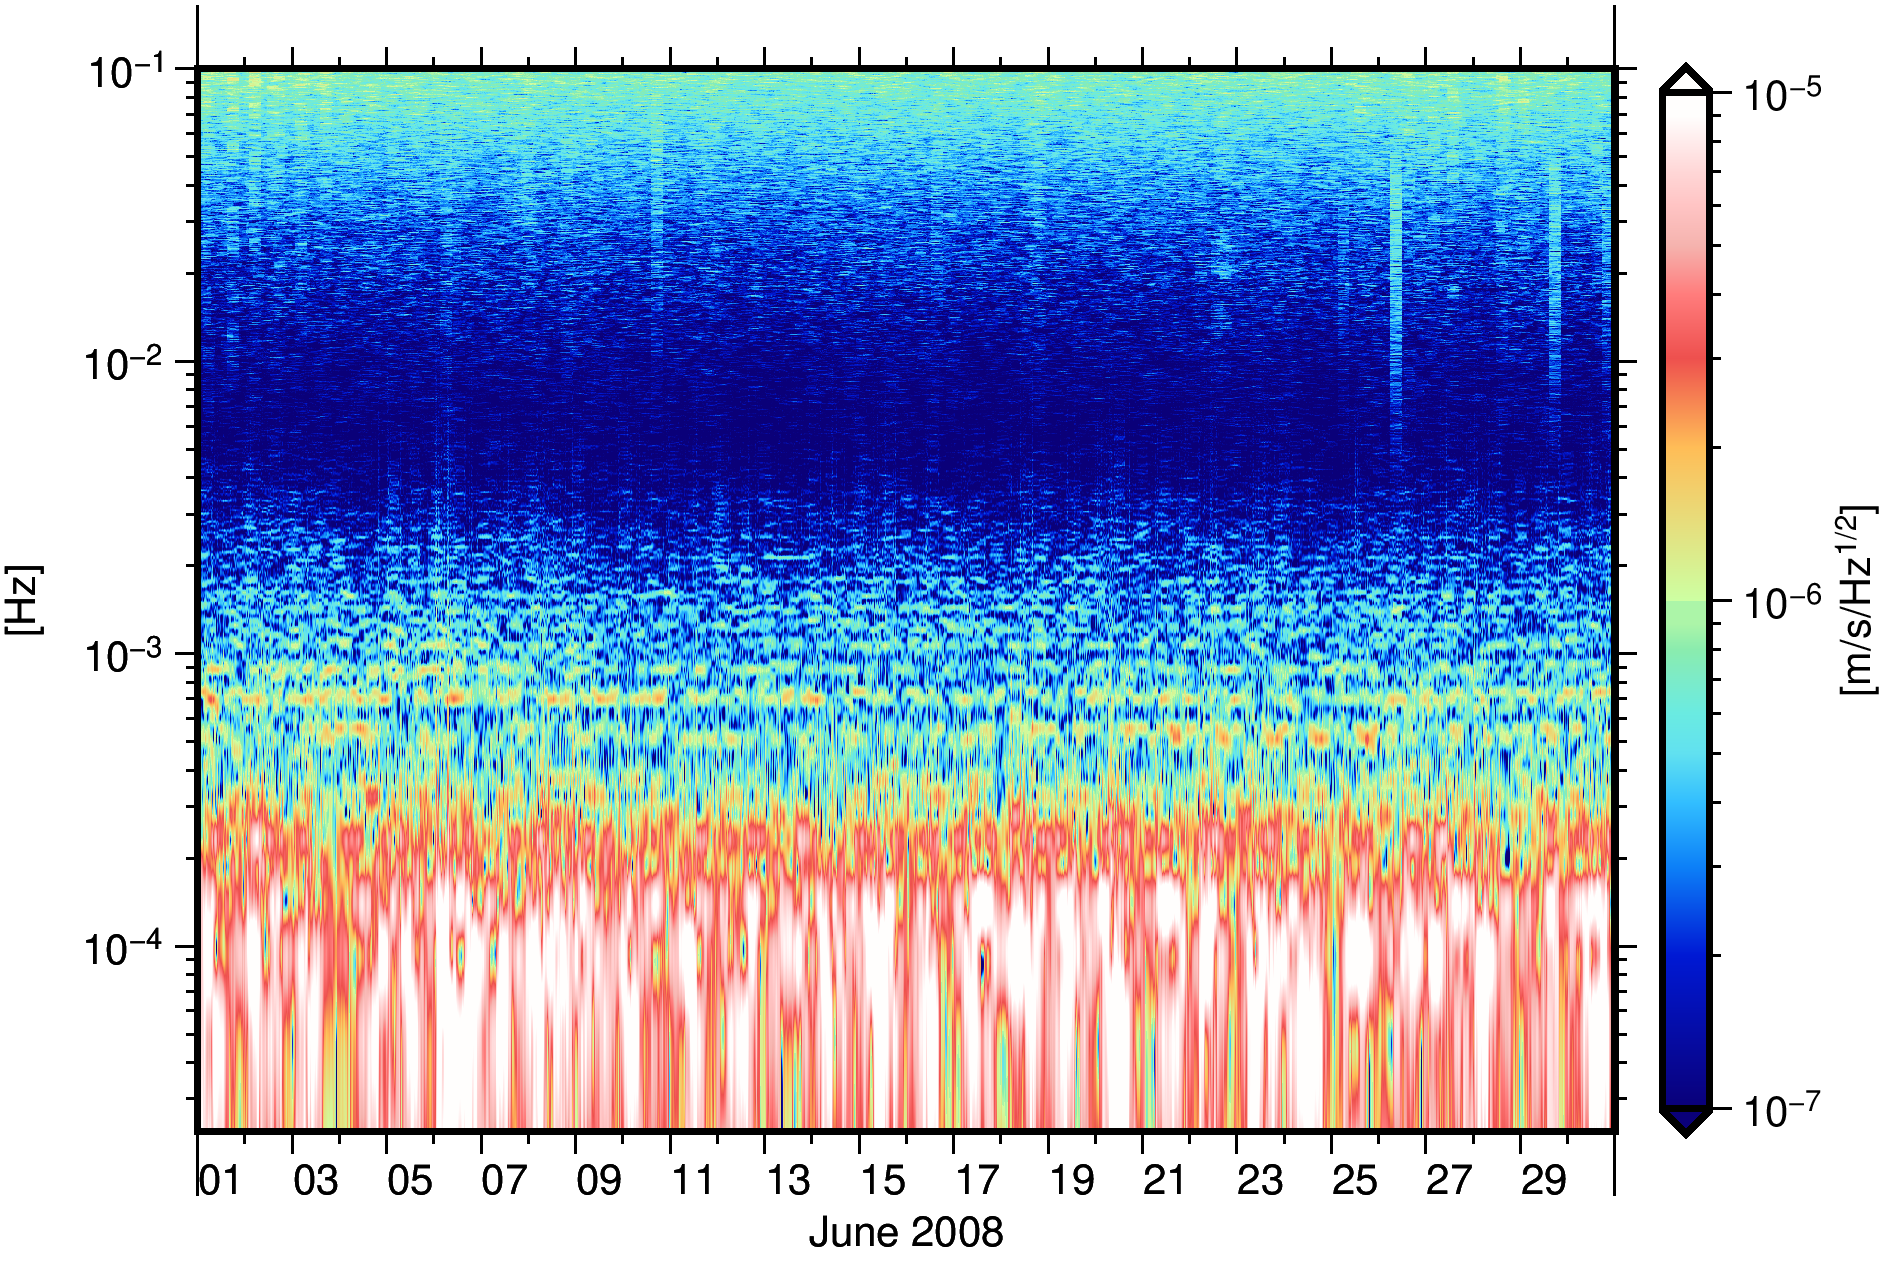
Instrument2Spectrogram
This program applies the Short Time Fourier Transform (STFT) to selected data columns of inputfileInstrument and computes the spectrogram. The STFT is computed at centered timeSeries with an (possible overlapping) rectangular window with windowLength seconds. Data gaps are zero padded within the window.
The outputfileSpectrogram is a matrix with each row the time (MJD), the frequency $[Hz]$, and the amplitudes $[unit/\sqrt{Hz}]$ for the selected data columns. It can be plotted with PlotGraph.

| Name | Type | Annotation |
|---|---|---|
outputfileSpectrogram | filename | mjd, freq, ampl0, ampl1, ... |
inputfileInstrument | filename | |
timeSeries | timeSeries | center of SFFT window |
windowLength | double | [seconds] |
startDataFields | uint | start |
countDataFields | uint | number of data fields (default: all) |