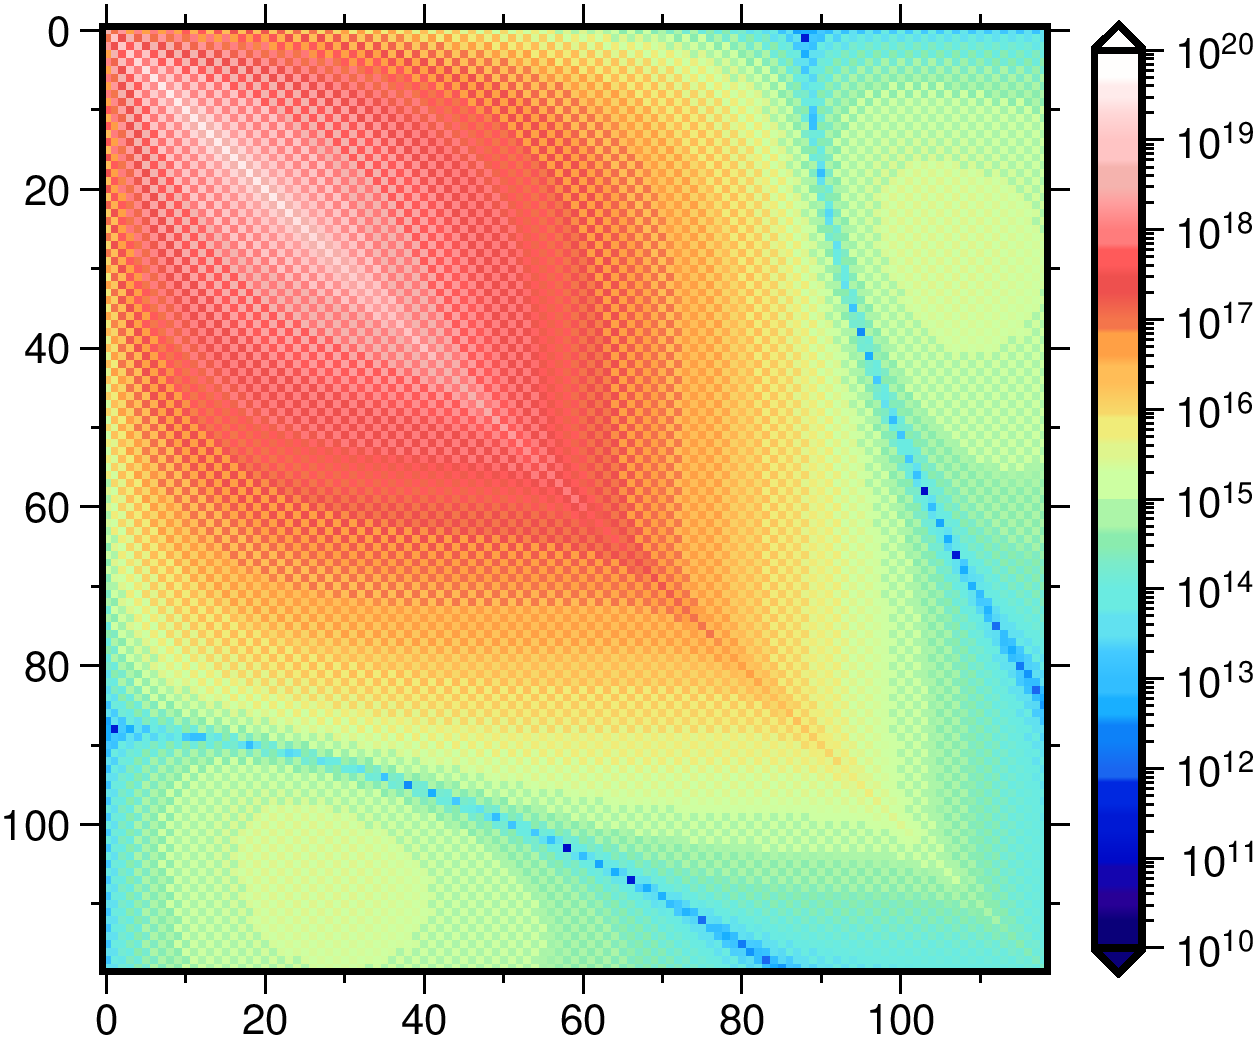
PlotMatrix
Plot the coefficients of a inputfileMatrix using the GMT Generic Mapping Tools (https://www.generic-mapping-tools.org). A variety of image file formats are supported (e.g. png, jpg, eps) determined by the extension of outputfile.
The plot programs create a temporary directory in the path of outputfile, writes all needed data into it,
generates a batch/shell script with the GMT commands, execute it, and remove the temporary directory.
With setting options:removeFiles=false the last step is skipped and it is possible to adjust the plot manually
to specific publication needs. Individual GMT settings are adjusted with options:options="FORMAT=value",
see https://docs.generic-mapping-tools.org/latest/gmt.conf.html.

| Name | Type | Annotation |
|---|---|---|
outputfile | filename | *.png, *.jpg, *.eps, ... |
title | string | |
inputfileMatrix | filename | |
minColumn | uint | minimum column index to plot |
maxColumn | uint | maximum column index to plot |
majorTickSpacingX | double | boundary annotation |
minorTickSpacingX | double | frame tick spacing |
gridLineSpacingX | double | gridline spacing |
minRow | uint | minimum row index to plot |
maxRow | uint | maximum row index to plot |
majorTickSpacingY | double | boundary annotation |
minorTickSpacingY | double | frame tick spacing |
gridLineSpacingY | double | gridline spacing |
gridLine | plotLine | The style of the grid lines. |
colorbar | plotColorbar | |
options | sequence | further options... |
width | double | in cm |
height | double | in cm |
titleFontSize | uint | in pt |
marginTitle | double | between title and figure [cm] |
drawGridOnTop | boolean | grid lines above all other lines/points |
options | string | |
transparent | boolean | make background transparent |
dpi | uint | use this resolution when rasterizing postscript file |
removeFiles | boolean | remove .gmt and script files |