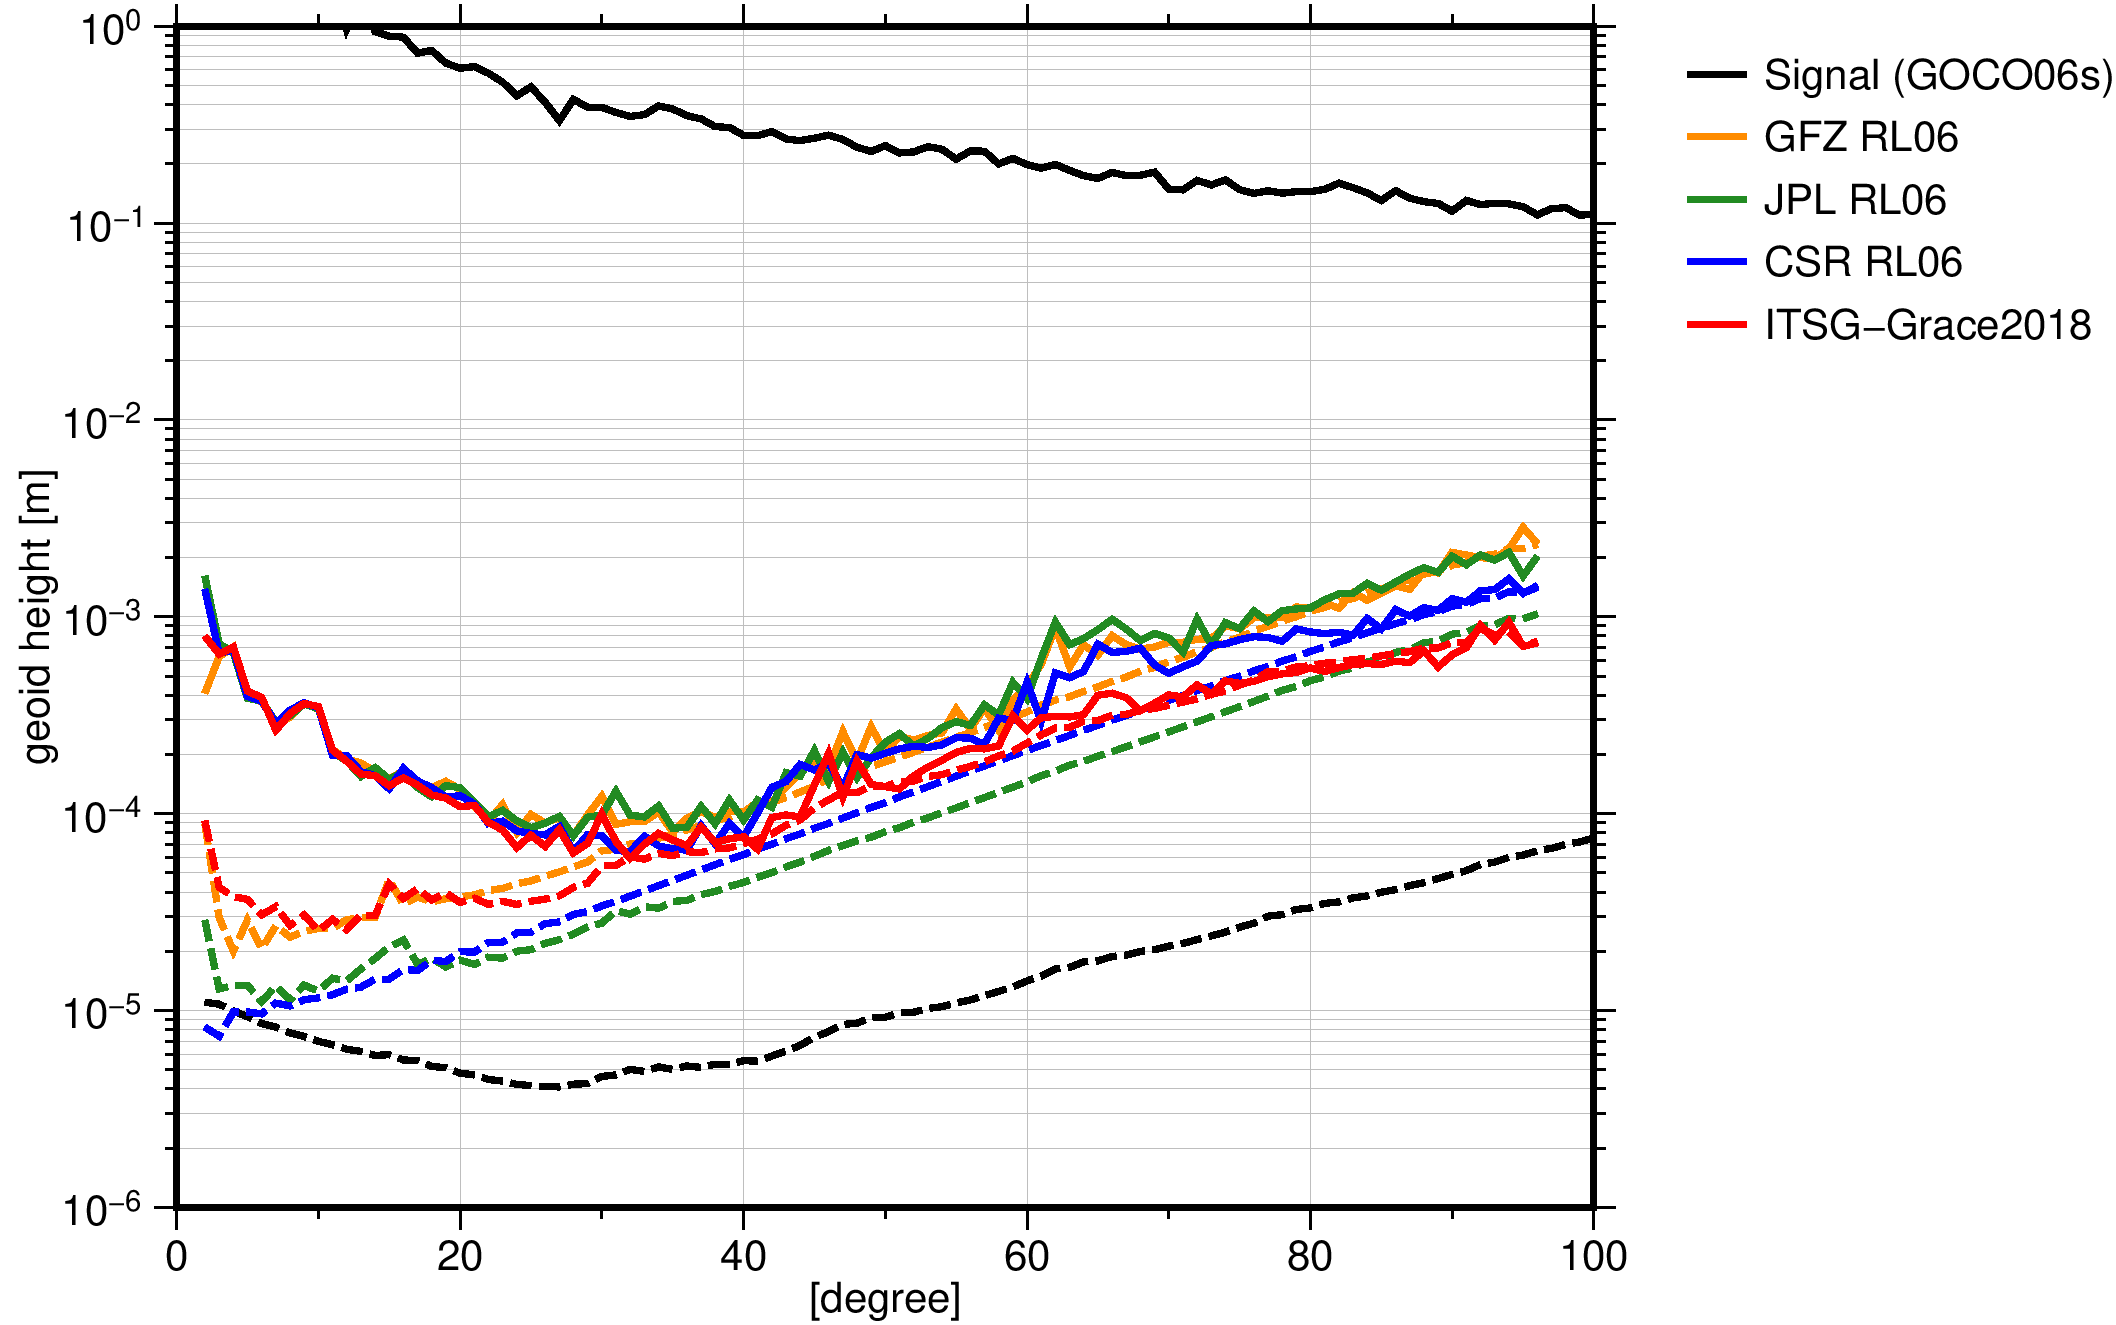
PlotDegreeAmplitudes
Plot degree amplitudes of potential coefficients computed by Gravityfield2DegreeAmplitudes or PotentialCoefficients2DegreeAmplitudes using the GMT Generic Mapping Tools (https://www.generic-mapping-tools.org). A variety of image file formats are supported (e.g. png, jpg, eps) determined by the extension of outputfile. This is a convenience program with meaningful default values. The same plots can be generated with the more general PlotGraph.

| Name | Type | Annotation |
|---|---|---|
outputfile | filename | *.png, *.jpg, *.eps, ... |
title | string | |
layer | plotGraphLayer | |
minDegree | uint | |
maxDegree | uint | |
majorTickSpacingDegree | double | boundary annotation |
minorTickSpacingDegree | double | frame tick spacing |
gridLineSpacingDegree | double | gridline spacing |
labelDegree | string | description of the x-axis |
logarithmicDegree | boolean | use logarithmic scale for the x-axis |
minY | double | |
maxY | double | |
majorTickSpacingY | double | boundary annotation |
minorTickSpacingY | double | frame tick spacing |
gridLineSpacingY | double | gridline spacing |
unitY | string | appended to axis values |
labelY | string | description of the y-axis |
logarithmicY | boolean | use logarithmic scale for the y-axis |
gridLine | plotLine | The style of the grid lines. |
legend | plotLegend | |
options | sequence | further options... |
width | double | in cm |
height | double | in cm |
titleFontSize | uint | in pt |
marginTitle | double | between title and figure [cm] |
drawGridOnTop | boolean | grid lines above all other lines/points |
options | string | |
transparent | boolean | make background transparent |
dpi | uint | use this resolution when rasterizing postscript file |
removeFiles | boolean | remove .gmt and script files |